Overview
DirectShow filters pass media samples (portions of data) through graphs and details of how the streaming happens exactly is important for debugging and troubleshooting DirectShow graphs and development. A developer needs clear understanding of parts of streaming process, importance of which increases with multiple streams, threads, parallelization, cut-off times, multiple graphs working simultaneously.
Details of streaming is typically hidden from top level control over the graph where the application is controlling state of the process overall, and then filters are on their own sending data through.
DirectShowSpy provides API to filters to register media samples as well as other details of streaming process, including comments and application defined emphasis (highlighting), it stores the traces and provides UI to review and export the traces for analysis and troubleshooting.
A similar tracing is implemented by GraphStudioNext Analyzer Filter.
Image may be NSFW.
Clik here to view.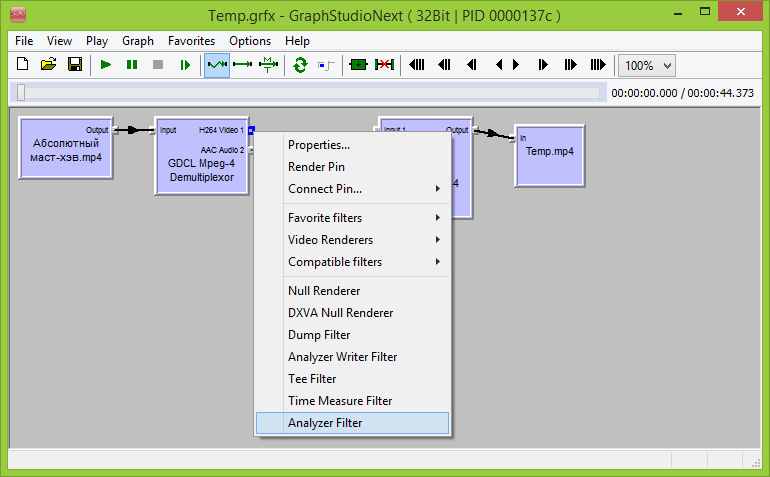
DirectShowSpy trace is different in several ways:
- DirectShowSpy is a drop-in module and adds troubleshooting capabilities to already built and existing application, including that it is suitable for temporary troubleshooting in production environment
- DirectShowSpy offers tracing for filter which are private and not registered globally
- DirectShowSpy tracing better reproduces production application environment
- DirectShowSpy allows supplementary application defined comments, which are registered chronologically along with media samples tracing
- it is possible to trace not only at filter boundaries/granularity, but also internal events and steps
- DirectShowSpy combines tracing from multiple graphs, multiple processes and presents them in a single log
DirectShowSpy media sample trace is a sort of log capability, which is implemented with small overhead. The traces reside in RAM, backed by paging file and are automatically released with release and destruction of filter graph. The important exception is however the media sample tracing UI of DirectShowSpy. When UI is active, each (a) manual refresh of the view, and (b) each destruction of filter graph in analyzed process makes UI add a reference to trace data and data lifetime is extended up to closing of DirectShowSpy UI.
The important feature of behavior mentioned above is that media tracing data outlives, or might outlive the processes that host filter graphs. As long as UI is active, processes including terminated expose media sample trace for interactive review.
Basically the feature is to review a streaming session details obtained from the filters which registered the respective events. For example, this filter graph
Image may be NSFW.
Clik here to view.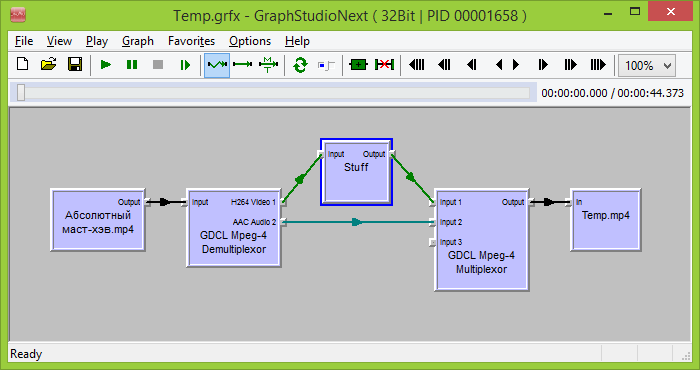
has two filters, MPEG-4 demultiplexer and multiplexer, which register streaming events. Because the trace is chronological, it in particular allows seeings how “Stuff” filter is doing the processing: threads, timings. If “Stuff” filter registers its own events, the picture becomes more complete.
Image may be NSFW.
Clik here to view.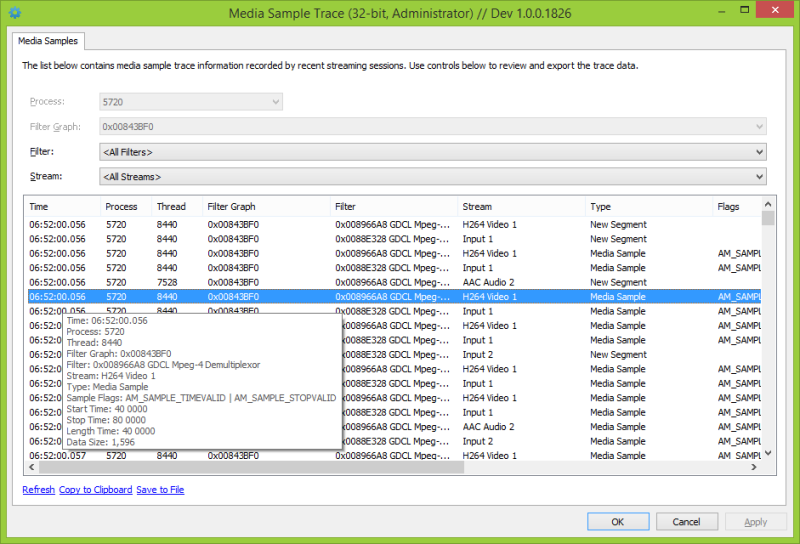
Using
To leverage media sample traces, a filter developer obtains ISpy interface from filter graph (which succeeds when DirectShowSpy is registered and hooks between application and DirectShow API) and creates a IMediaSampleTrace interface using ISpy::CreateMediaSampleTrace call. An example of such integration is shows in a fork of GDCL MPEG-4 filters here, in DemuxOutputPin::Active method.
It does not matter whether filter and pins are sharing IMediaSampleTrace pointers. Each CreateMediaSampleTrace creates a new trace object, which is thread safe on its own, and data is anyway combined on UI from all sources of tracing.
With no DirectShowSpy registered, QueryInterface for ISpy fails and this is the only expense/overhead of integration of media sample tracing in production code.
A developer is typically interested in registering the following events:
- Segments starts, media sample receives and deliveries, end of stream events; DirectShowSpy introduces respective methods in
IMediaSampleTraceinterface:RegisterNewSegment,RegisterMediaSample,RegisterEndOfStream - Application defined comments, using
RegisterCommentmethod
All methods automatically track process and thread information associated with the source of the event. Other parameters include:
- filter interface
- abstract stream name, which is a string value and can be anything; typically it makes sense to use pin name/type or it can be pin name with appended stage of processing if developer wants to track processing steps as they happen in the filter; UI offers filtering capability for stream values, and separate column in exported text so that filter could be applied in spreadsheet software such as Excel when reviewing the log
- user defined comment and highlighting option
RegisterMediaSample methods can be used with anything associated with a media sample, not exactly one event per processing call. The method logs media sample data (it takes AM_SAMPLE2_PROPERTIES pointer as byte array pointer) and makes it available for review with its flags and other data.
Comments can be anything and are to hold supplementary information for events happening in certain relation to streaming:
Image may be NSFW.
Clik here to view.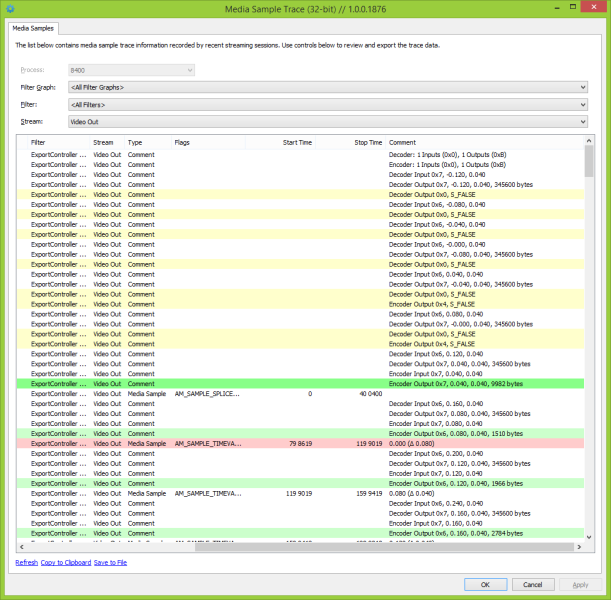
An application can automatically highlight the log entries to draw attention to certain events. For example, if data is streamed out of order and the filter registers the event with highlighting, the entry immediately drawing attention on UI review. Then interactive user can change the highlighting interactively as well:
Image may be NSFW.
Clik here to view.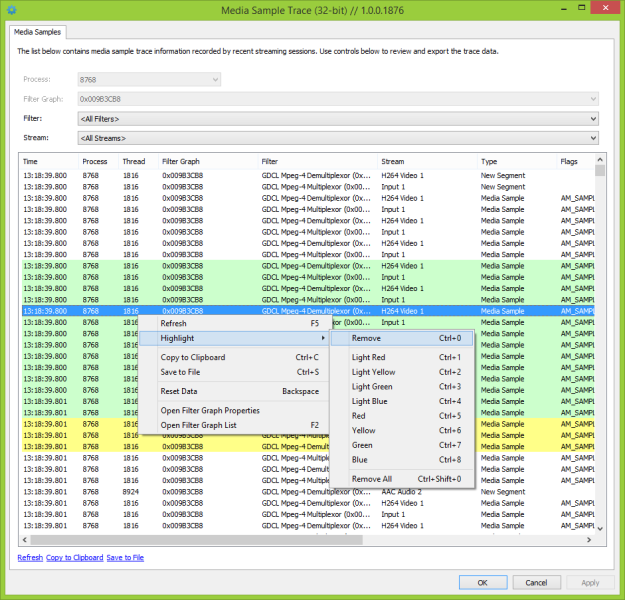
The media trace data can be conveniently filtered right in DirectShowSpy UI, which is invoked by DoMediaSampleTracePropertySheetModal exported function, or copied to clipboard or saved as file in tab-separated values format. The file can be opened with Microsoft Excel for further review.
Limitations
- there is a global limit on in-memory trace storage; there is no specific size in samples (it’s 8 MB for global registry of data here) and the storage is large enough to hold streaming of a movie with multiple tracks, however once in a while it is possible to hit the limit and there is no automatic recycling of data: the data is released with last copy of UI closed and graphs released in context of their respective processes
- traces are visible from the same session only, in particular processes with elevated privileges are “visible” by similarly started DirectShowSpy UI and vice versa
- 32-bit process traces are visible from 32-bit DirectShowSpy UI, and the same applies to 64 bits; technically it is possible to share that but it is not implemented
Download links
- Binaries:
- 32-bit: DirectShowSpy-Win32.dll (1.0.0.1876)
- 64-bit: DirectShowSpy-x64.dll (1.0.0.1875)
- Shortcuts to Exported Functions: Helper
.BATfiles - License: This software is free to use
- Installation Instructions: Original post
Additional stuff
A fork of GDCL MPEG-4 filters is uploaded to GitHub, which in particular has integration with media sample tracing and includes pre-built binaries, 32- and 64-bit versions.